How to Make a Chore Chart That Actually Works: Audit Before You Design
Most chore charts die within two weeks. They start with good intentions — a laminated grid on the fridge, gold stars, genuine enthusiasm — and then quietly fade into wallpaper. The problem usually isn’t the chart itself. It’s the system behind it.
This guide walks through how to build a chore chart that sticks: one grounded in how households actually function, what motivates different people (especially kids), and why accountability needs to be built into the design from the start.

Why Most Chore Charts Fail
Before building anything new, it helps to understand what goes wrong.
The chart is too ambitious. A first-week chart might list 20 daily tasks. By week two, nobody can keep up, so everyone quietly stops trying.
There’s no ownership. When tasks are assigned top-down without input from the people doing them, resentment builds fast — especially with older kids and teenagers.
The reward structure breaks down. Sticker charts work beautifully for kids under seven or eight. For older children and adults, the same approach feels patronizing. If the motivation doesn’t match the person, the chart won’t either.
Nobody reviews it. A chore chart that isn’t discussed regularly is just decoration. The review moment — even a five-minute weekly check-in — is what turns a chart into a working system.
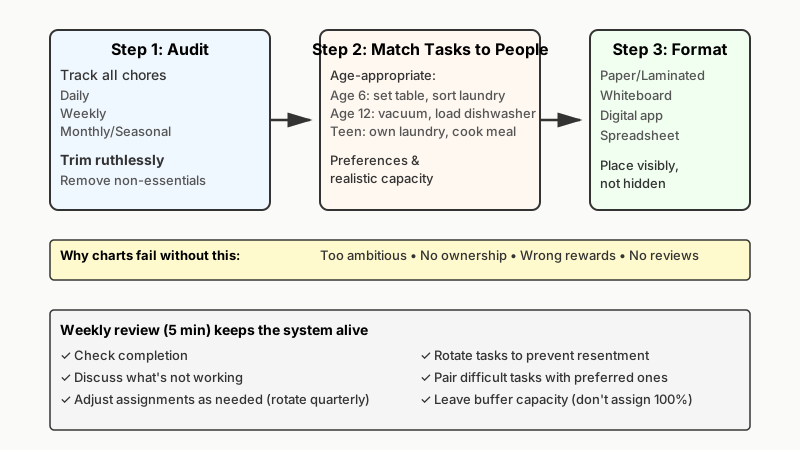
Step 1: Audit Your Household First
Don’t design the chart until you know what actually needs doing. Spend one week writing down every chore that gets done (or that should get done but doesn’t). Group tasks by frequency:
- Daily: dishes, wiping counters, taking out trash if needed, feeding pets, tidying common areas
- Weekly: vacuuming, mopping, laundry, bathroom cleaning, grocery shopping
- Monthly or seasonal: cleaning inside the fridge, washing windows, deep-cleaning the oven, decluttering
This audit usually surprises people. The invisible labor — the tasks that one person silently absorbs — becomes visible on paper. That alone can shift household conversations.
Once you have the full list, trim it ruthlessly. If something doesn’t need to happen every week, don’t put it on the weekly chart. Seasonal tasks belong in a separate calendar, not cluttering the daily view.
If clutter is part of what’s fueling the chaos you’re auditing, How to Declutter Your Home Step by Step (That Actually Works) offers a similar step-by-step approach to tackling it.
Step 2: Match Tasks to People Honestly
Age-appropriate assignment matters more than fairness in the abstract. A six-year-old can set the table, sort laundry by color, and wipe baseboards. A twelve-year-old can vacuum, load the dishwasher, and take out bins. A teenager can handle their own laundry end-to-end and cook one dinner a week.
For adults sharing a household, this step is really a negotiation. Some people hate vacuuming but don’t mind doing dishes. Matching tasks to genuine preferences (where possible) reduces drag. If one person travels for work, their chart needs to reflect that reality — not an ideal week.
A few principles that help:
- Pair a hated task with a liked one when assigning to yourself or your kids. Cleaning the toilet followed by a task someone doesn’t mind reduces the psychological weight.
- Rotate tasks quarterly so nobody permanently owns the worst job in the house.
- Build in buffer. Don’t assign every available person to 100% of their capacity. Illness, homework overload, and late nights happen.

Step 3: Choose the Right Format
The format should match your household’s habits, not the one that looks best on Pinterest.
Paper charts work well for young children because they’re tactile and visible. A laminated chart with dry-erase markers lets kids check off tasks without wasting paper. Magnetic chore boards (available at most home stores) serve the same purpose.
Whiteboard systems are popular with families who make frequent adjustments. A weekly grid on a wall-mounted whiteboard lets you reassign tasks on the fly without redrawing everything.
Digital tools suit households where people are rarely in the same place. Apps like OurHome, Tody, and Habitica let you assign tasks, send reminders, and track completion from a phone. Habitica gamifies chores with RPG-style rewards, which works surprisingly well for teenagers and adults who enjoy that kind of thing.
Spreadsheets (shared via Google Sheets) give households more control over layout and are easy to update. They’re not visual or motivating on their own, but they work well as a backend system that feeds into something more visible.
Whatever format you choose, the chart needs to be somewhere unavoidable — not buried in a folder or an app nobody opens. The fridge, the hallway, the kitchen corkboard. Physical visibility does a lot of the motivational work.
Step 4: Write Tasks as Actions, Not Categories
This is a small change that makes a big difference. “Clean bathroom” means something different to a ten-year-old than it does to an adult. Instead, write:
- Scrub toilet bowl with brush
- Wipe sink and faucets with cloth
- Sweep floor
- Empty trash bin
Action-level specificity removes the excuse of “I didn’t know what you meant” and eliminates the frustration of inspecting a half-done job. It also makes onboarding new family members (or teaching a child a task for the first time) much easier because the chart itself is the instruction.
For recurring tasks that involve judgment — like “tidy the living room” — photograph what the room looks like when it meets the standard. Post that photo or keep it accessible. A reference image cuts arguments faster than any amount of verbal explanation.
Step 5: Build In a Real Accountability System
Accountability doesn’t mean punishment — it means the chart has a mechanism for honest review. Without it, tasks get quietly skipped and nobody says anything until resentment builds.
A few approaches that work:
Weekly family check-in (10 minutes, max). Sit down every Sunday — or whichever day feels natural — and go through the chart together. What got done? What didn’t? What needs to change next week? Keep it light and practical, not a critique session.
Visible completion markers. Checkboxes, dry-erase ticks, flipped magnets — anything that makes completion physically visible encourages follow-through. The act of marking something done provides a small but real sense of satisfaction.
Consequences that make sense. For kids, this might mean screen time is tied to completed chores — not as punishment, but as a logical sequence (responsibilities first, then leisure). For adults sharing a household, the conversation is more peer-level: “You said you’d handle the bins; they weren’t taken out twice this week — what happened?”
Avoid charts that require one person to constantly police everyone else. That’s exhausting and breeds resentment. Build the system so the chart does the reminding, not a person.
The same friction-first thinking applies beyond chore charts, as shown in our guide How to Keep a Workspace Tidy: Design a System That Fights Friction.
Step 6: Get the Motivation Right
Different household members need different motivators — and mixing them up is one of the most common failure points.
For young children (ages 4–8): Visual progress works well. Sticker charts, magnetic reward boards, and physical tokens (a marble in a jar for each completed task) give concrete feedback. A small reward — a trip to the park, choosing a movie — when the jar is full keeps the loop going.
For tweens and early teens (ages 9–14): Autonomy is often more motivating than rewards. Giving this age group real input on which chores they own, and letting them decide when they do them (within reasonable limits), increases buy-in significantly. Research on self-determination theory suggests that autonomy support — giving people a sense of choice and control — is one of the most reliable drivers of intrinsic motivation.
For teenagers: Clear expectations with minimal nagging, combined with natural consequences, tends to work better than reward systems. If their laundry isn’t done, it doesn’t get done. If their room isn’t clean by a set standard by the weekend, plans change. Firm but non-punitive.
For adults: Fairness and transparency matter most. When the division of labor is visible and agreed-upon, there’s less room for the “I do everything around here” feeling that derails so many households.

Step 7: Review and Revise Every Month
No chart should run unchanged for more than a month. Household life shifts — school schedules change, a new job starts, a child gets old enough for new responsibilities. A chart that made sense in September might be completely wrong by January.
Set a monthly five-minute reset: review the task list, reassign anything that’s causing friction, and update frequencies where needed. This isn’t a sign the system failed — it’s the system working.
Some households do a full quarterly overhaul: revisit which tasks each person owns, introduce new tasks for kids who’ve aged up, and archive the seasonal tasks onto a separate list. A quarterly reset also gives everyone a clean slate, which can re-energize a chart that’s gone stale.
Common Pitfalls to Avoid
- Don’t laminate on day one. Build the chart in pencil (metaphorically) for the first few weeks. You’ll almost certainly need to adjust it.
- Don’t ignore invisible labor. Chores like scheduling appointments, tracking household supplies, and managing kids’ activities are real work. They belong on the chart or in an explicit conversation about who owns them.
- Don’t conflate cleanliness standards. If two adults have genuinely different tolerance thresholds for mess, the chart won’t solve that underlying disagreement. Name it, negotiate it, then build the chart around the agreed standard — not an assumed one.
- Don’t skip the win. When the system is working — when the kitchen is reliably clean and nobody had to ask — say so. Noticing what’s going well is part of keeping the chart alive.
Conclusion
A chore chart that works isn’t magic — it’s specificity, buy-in, and honest review, repeated consistently. The chart is just the visible surface of a system underneath it: one that distributes labor fairly, matches tasks to people, and has a real mechanism for holding things together when life gets busy.
Start with the audit. Keep the first version simple. Review it often. The chart you build in month three will be better than the one you start with — and that’s exactly how it should be.